 Virtual Embryo
 Temporal gene-expression distribution prediction
The question
Participants will predict the gene-expression distribution of a heart-centred dissection at a developmental stage the model has never seen, given the stages before it. The prediction is a population of cells (progenitors, differentiating cells and terminal types in their real proportions) not an average cell. A model that collapses onto the mean profile forfeits most of the score.
Staging an embryo is destructive and each time point is a different animal, so a stage that was not collected cannot be recovered by re-running the experiment; and the gap between collected stages is often where the interesting transitions happen. Here nothing sits between the validation and test stages at all, so interpolation has nothing to lean on.
To keep the task tractable we release two fully observed earlier stages of real dissociated single cells. RNA across the whole transcriptome, not the 500-gene MERFISH panel Tasks 2 and 3 use. Participants may additionally train on external public single-cell data; only the evaluation stages are fixed, and any external source must be disclosed with the submission.
Modality
Real dissociated single cells. Whole transcriptome (32,285 genes, log1p-normalised, with cell-type annotation) and explicitly not the 500-gene MERFISH panel that Tasks 2 and 3 use. There are no spatial coordinates in this modality, and none are expected in a Task 1 submission.
Splits
Ground truth is withheld while it can still affect the board. Until the final phase a validation submission returns a leaderboard score, not the answers. At the start of the final phase the validation answers are released for every task (ranking has moved to the hidden test split by then, so they can no longer be used to probe it) and the test leaderboard opens. Test ground truth is never distributed.
- Train
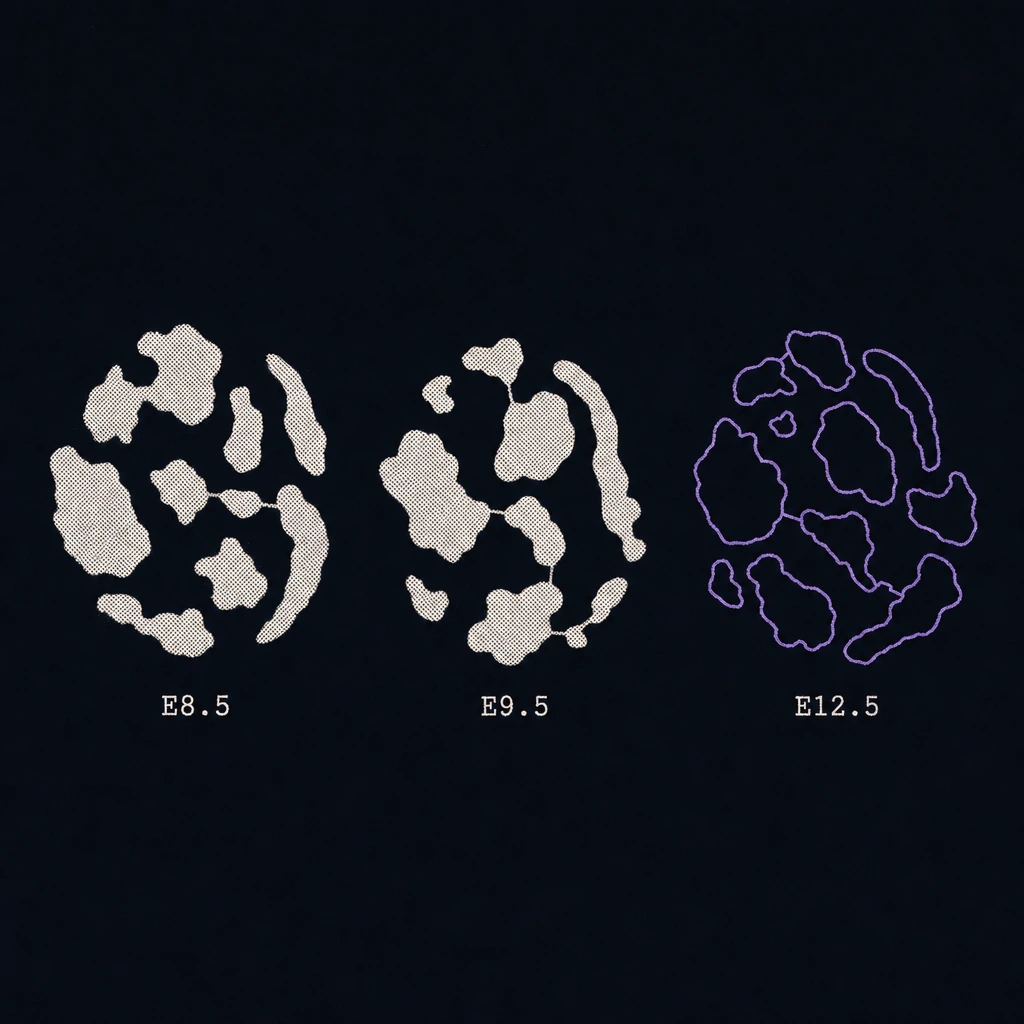
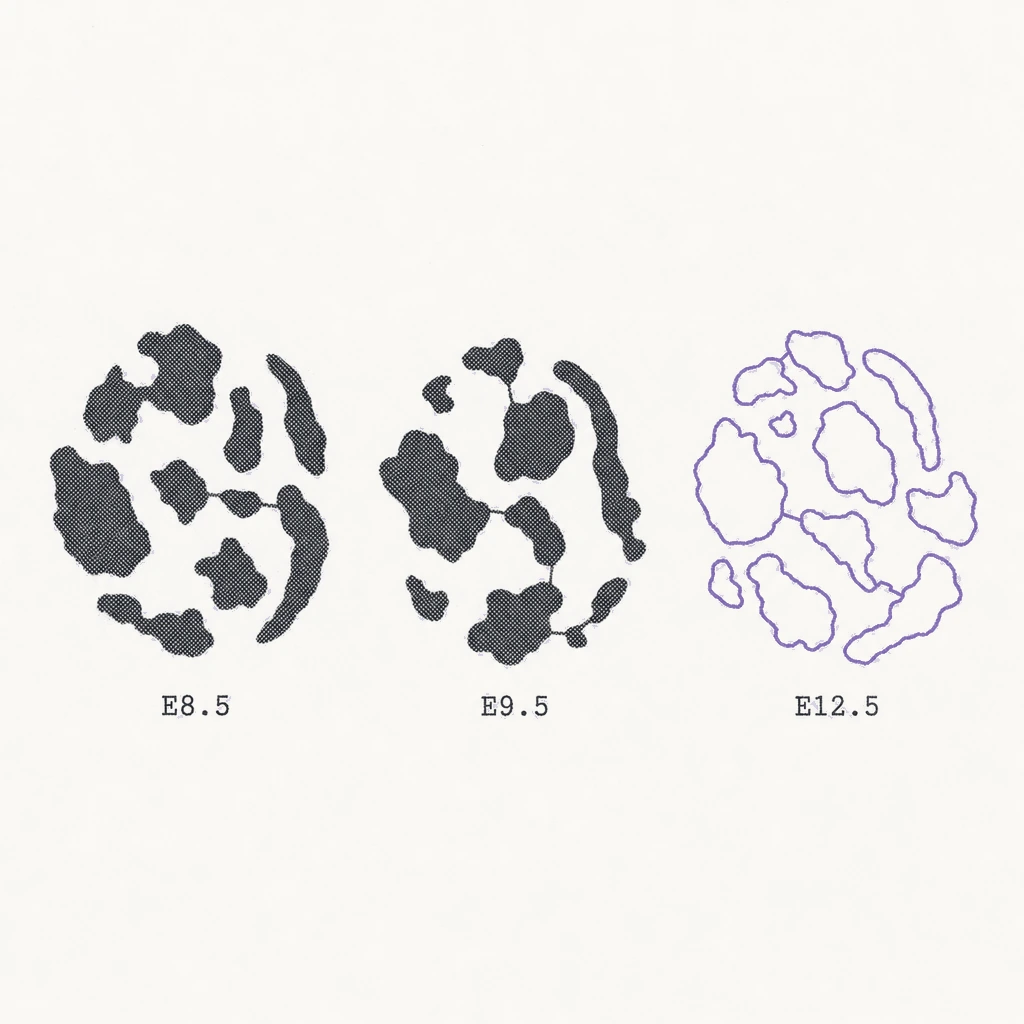
- E8.5 · E9.5
- The two real single-cell stages before the target. There is no E9.25 in this release.
- Validation
- E10.5
- Scored through the leaderboard until the final phase, when the answers are released.
- Test
- E12.5
- Hidden. Scored only in the final phase.
- Not released
- E7.75
- A whole-embryo stage rather than a heart-centred one: through gastrulation the embryo is small enough to profile entire, and by E8.5 it is not, so collection narrows to the organ. It is not distributed. E7.75 is the hidden test target for Task 2’s embryo interpolation, and measured data at a held-out stage is not released for any task, whichever assay produced it.
Input and output
- Input
- The public training stages, as per-cell expression matrices with cell-type annotation. Participants may additionally train on external public single-cell data, only the evaluation stages are fixed, provided the source is disclosed with the submission. At inference the model is given the target stage and must emit a predicted set of cells for it.
- Output
- An AnnData file whose .X is the predicted expression matrix over the whole transcriptome, in the released gene order. No cell-type labels: the organisers assign types with a frozen classifier applied identically to every submission.
The exact file contract and validation rules →
How it is scored
Four metrics rank Task 1, each its own weighted question: DE gene recovery 25%, change direction 25%, cell-state distribution 30%, gene-gene co-variation 20%. Task 1 has no spatial component, so no shape term applies.
- 25%
- DE gene recovery
Did you get the key up- and down-genes right?
- 25%
- Change direction
Genome-wide direction and ranking of the change.
- 30%
- Cell-state distribution
The right cell states, in the right proportions.
- 20%
- Gene-gene co-variation
Co-regulation preserved, not just per-gene marginals.
Every metric, with its derivation →
What the starter kit ships
Transparent reference points, not competitive upper bounds: a floor, a simple method, and a dynamics reference model, all with the exact evaluation code.
- copy_last: the floor.
- pseudobulk_shift: a one-line constant shift by the observed pseudobulk delta.
- shift_ode. Kept because its minimiser is that same constant shift, so the equivalence stays visible.
- neural_ode: an autonomous field in gene space, flow-matched on a global entropic-OT coupling.
- dynode_flow: the external flow-matching reference model, unmodified.
Why it’s hard
- No observed stage sits between E10.5 and E12.5, so naive temporal interpolation has nothing to lean on.
- E8.5 and E9.5 carry 18 and 21 annotated cell types and share 11 of them, so roughly half the cells at E9.5 have a same-named predecessor at the earlier stage; between E9.5 and the E10.5 validation target it is 13 of 23 types and about the same half. This is not a statement about difficulty so much as about frame: the other half either appeared through differentiation or is annotated under a name the earlier stage does not use, and every cell-type-matched baseline in the starter kit simply holds those fixed. Velocity extrapolation has nothing to move much of the target by, so the modelling problem is the appearance of new cell states, not the displacement of old ones.
- The reference neural ODE does not beat the one-line constant shift, and that is the published result rather than a bug. Clearing the floor plausibly needs supervision across the whole stage ladder, a non-autonomous field, and a treatment of populations appearing rather than only existing ones moving.
- The floor is not weak: fitting the same extrapolation off the evaluation stages lands every setting below copy_last, the constant shift included.
Common pitfalls
- Predicting a tightly clustered distribution. Mode collapse clears a mean-based diagnostic and then fails ED, MMD and CSS.
- Submitting a scaled copy of the reference. Both DE metrics now measure a null built from exactly that attack, in both directions.
- Assuming the panel is the 500-gene MERFISH set. Task 1 is whole-transcriptome single-cell.
- Including cell-type labels and tuning to them. Labels are never part of a submission and are re-assigned by the frozen probe.
Other tasks
Reach the organisers at [email protected].